DATA SCIENCE · 2026
Unicorn Time to Scale Analysis
The situation
A widely repeated claim in startup media is that unicorns are getting faster to build, that newer companies reach a billion-dollar valuation in a fraction of the time older ones took. This project tests that claim directly against a public dataset of 1,073 unicorn companies rather than taking the headline at face value.
The dataset was scraped shortly after April 2022, which turns out to matter more than any modelling choice made afterward. The analytical problem is a specific and common trap: whether an apparent trend over time is real, or an artifact of how and when the data was collected.
The work
The starting point was 1,073 companies, cleaned the way the Salifort dataset was: document every rule, keep the raw file untouched, and count what each decision removed. Three companies founded before 1990 came out as a stated rule rather than a one-off exclusion, since the founding-year distribution has a genuine gap between 1985 and 1989. One company had a founding year that postdated its date joined with no way to resolve it from available data, so it came out too. Final count: 1,070.
The first pass at the headline question looked conclusive. Grouping mean years-to-unicorn by founding cohort produced a sharp, clean slope: 21.4 years for companies founded before 2000, down to 4.0 years for companies founded in 2015 or later. Read at face value, that says unicorns are getting dramatically faster to build, and it's the kind of chart that gets shared without anyone checking how it was produced.
It doesn't survive the check. The dataset only contains companies that have already reached a billion dollars, and only as of when it was scraped. That creates right-truncation: a company founded in 1995 has had about 27 years to cross the threshold, enough time for essentially every eventual unicorn from that cohort to have already appeared. A company founded in 2020 has had at most two years, so only its fastest possible movers could be in the data yet. Any 2020-founded company that will take five, eight, or ten years to scale is invisible right now, not because it failed, but because it hasn't had time. The recent-cohort averages are pulled down by exactly this mechanism, and that's most of what produces the sharp naive slope.
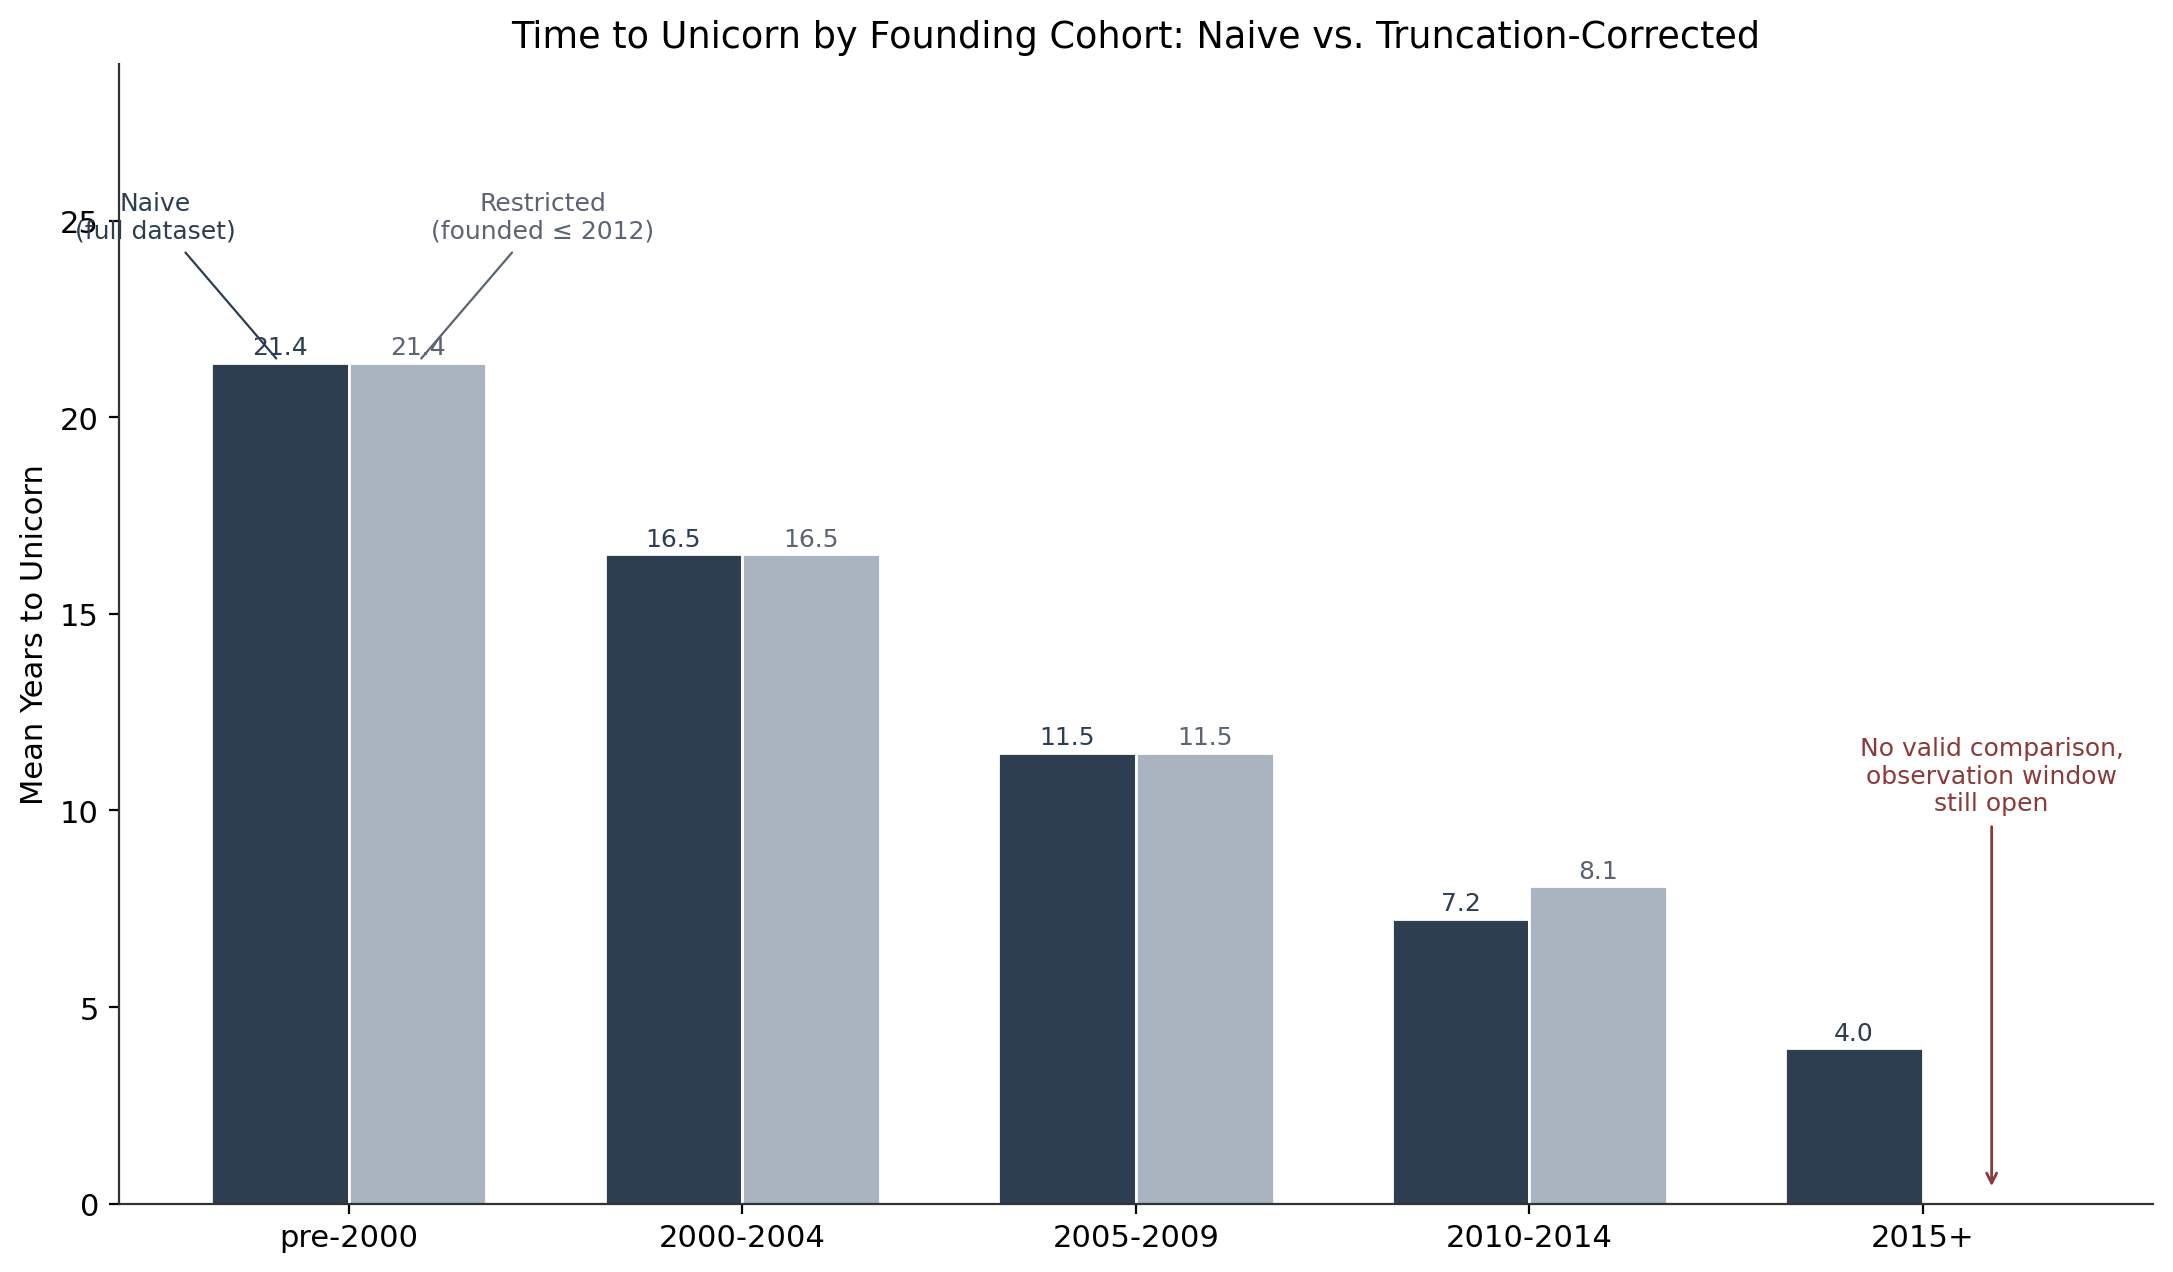
The correction took the direct route: restrict the comparison to companies founded on or before 2012, so every remaining company has had roughly the same ten-year window since the April 2022 collection cutoff to have qualified. That's a deliberately simple rule, stated plainly enough that a client could audit it in one sentence, rather than fitting two full models and comparing coefficients as the primary method. That comparison still ran afterward, as a second, independent check on the same finding.
The correction confirms the mechanism directly: the 2010-2014 cohort's mean rose from 7.2 to 8.1 years once the still-partially-observed 2013-2014 companies were removed, exactly what truncation bias predicts. And the naive chart's most dramatic point, the 2015+ cohort averaging 4.0 years, can't be reproduced under a fair comparison at all: no company founded after 2012 has had enough time yet to be judged on equal footing with the older cohorts, so that number should never have been presented as a finding.
Modelling ran three tiers, a median baseline, linear regression, and Random Forest, each run once on the naive dataset and once on the restricted one, with valuation and funding excluded from every model since both are measured at or after the outcome itself and would leak information about it. Both real models landed around R² 0.70 on the restricted data, meaningful without overclaiming: time to unicorn depends on factors this dataset doesn't capture, and a model that explained nearly all of it would be a sign of leakage, not skill. The same truncation story showed up a third way here: the naive linear model's founding-cohort coefficients still carried almost the full naive trend even after controlling for industry, continent, and investor features, and the Random Forest's feature importance for the 2015+ cohort dropped to exactly zero once restricted, since that category had no companies left to learn from.
How it went
The corrected finding is smaller than the naive one, and it's real: mean years-to-unicorn fell from 21.4 for companies founded before 2000 to 8.1 for the 2010-2014 cohort. Unicorns are getting faster to build. They are not getting faster at the rate the uncorrected data implies.
The regional section applied the same discipline in a different place. Israel's 20 companies are a genuine outlier for population size, and it would have been easy to report a headline about Israeli startups scaling faster. The data doesn't support that: Israel's median time to unicorn (6.0 years) matches the United States exactly and trails China's (5.0 years). What makes Israel notable is volume relative to population, not velocity, a different and more defensible claim than the one the sample size tempts you to make. The three UAE companies in the dataset, Vista Global, Emerging Markets Property Group, and Kitopi, are named individually rather than averaged, since a mean at n=3 would imply a precision that doesn't exist.
The honest limitation: founding year is recorded as a whole year, not an exact date, so the restriction rule gives each company roughly a ten-year window, not a guaranteed exact one. That's a minor imprecision measured in months against decade-long windows, not comparable in scale to the truncation problem it corrects.
8.1 yrs
corrected mean, 2010-2014 cohort (naive figure: 7.2)
What it proves
Finding and reporting the artifact undermining a compelling result, rather than letting a clean-looking chart stand unexamined, and quantifying how much of a headline trend is real after correcting for a specific, named bias, rather than either accepting or dismissing the whole narrative. The valuable output here was not the regression, it was catching that the dataset's own collection cutoff was inflating the newest cohort's apparent speed, and stating precisely how much of the original claim survives that correction.